

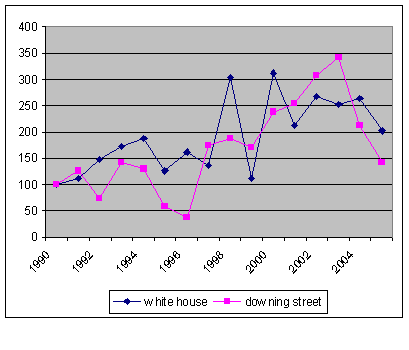
So on the subject of media attention to US and UK politics, these show the number of articles from the Times, FT and Guardian with different words in their headlines, 1990-2005. I rebased so that 1990=100, a dubious procedure because if 1990 was a very high or low year, that will make the subsequent pattern look better or worse. (In particular, take the White House/Downing Street comparison with a grain of salt.) Still, the trends are real enough. As far as I can see the story here is actually that Presidents and Prime Ministers have got more media attention, legislatures less. Country differences are pretty speculative.
No comments:
Post a Comment